
Violin Plot vs. Box Plot: When to Use Each in Scientific Papers
A clear decision guide for choosing between box plots, violin plots, and combined overlays in research figures.
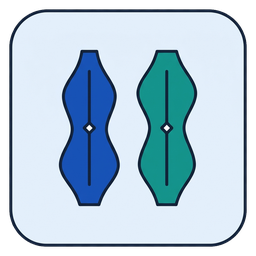
Gaussian KDE density shapes, adjustable bandwidth, inner box plot, and raw points.
Where box plots shine
Box plots deliver instant quartile precision and standardized outlier detection. They remain readable even with 6–12 observations per group and require no tuning parameter like KDE bandwidth.
What violin plots reveal that box plots hide
A bimodal distribution with two distinct subpopulations can share the exact same median and IQR as a uniform distribution. A Gaussian KDE violin exposes those twin peaks immediately.
Best practice: combine landmarks with density
For samples of n ≥ 15 per group, pairing a violin density curve with an inner IQR box and median dot—or overlaying raw jittered observations on a box plot—gives reviewers both exact summaries and full distributional transparency.